Variance is a question, not a color
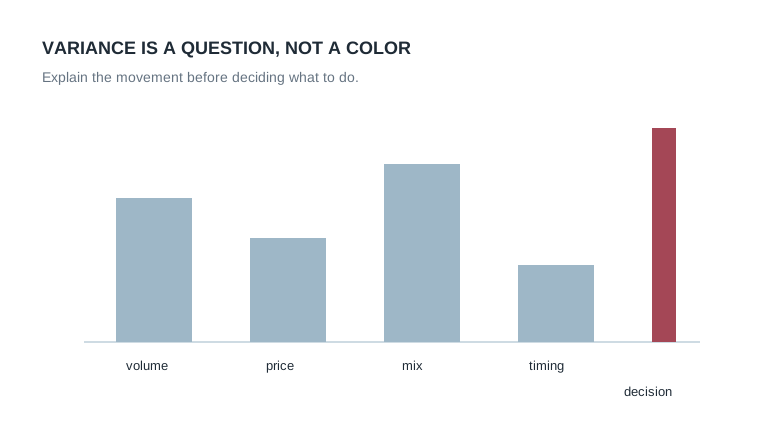
A red number does not explain whether the movement came from volume, price, mix, timing, or a data-quality problem. The useful work starts after the color appears.

Short fictional thought-leadership pieces demonstrate how a professional firm can build trust by explaining its point of view before asking for an inquiry.
A red number does not explain whether the movement came from volume, price, mix, timing, or a data-quality problem. The useful work starts after the color appears.
If nobody can say who decides what and when, another visualization usually adds surface area without improving the operating conversation.
Repeated manual reconciliation is a signal: the exception path, ownership, or source-system boundary may need to become explicit.
Useful forecasts make ownership, major assumptions, and the reason for changes visible enough to discuss—not merely overwrite the prior version.
The content system supports diagrams when they make the idea easier to understand. The visual remains lightweight, local, and accessible with a text equivalent.