01 / REPORTING DESIGN
Management reporting that answers a question.
Define the recurring decisions first, then shape the reporting package around the signals leaders actually need.
Reporting design →
Ledgerplain helps growing owner-led companies turn scattered finance routines into a clearer operating rhythm—shared definitions, visible exceptions, named owners, and reporting that supports decisions.
No accounting, tax, legal, investment, or regulated financial advice is provided.
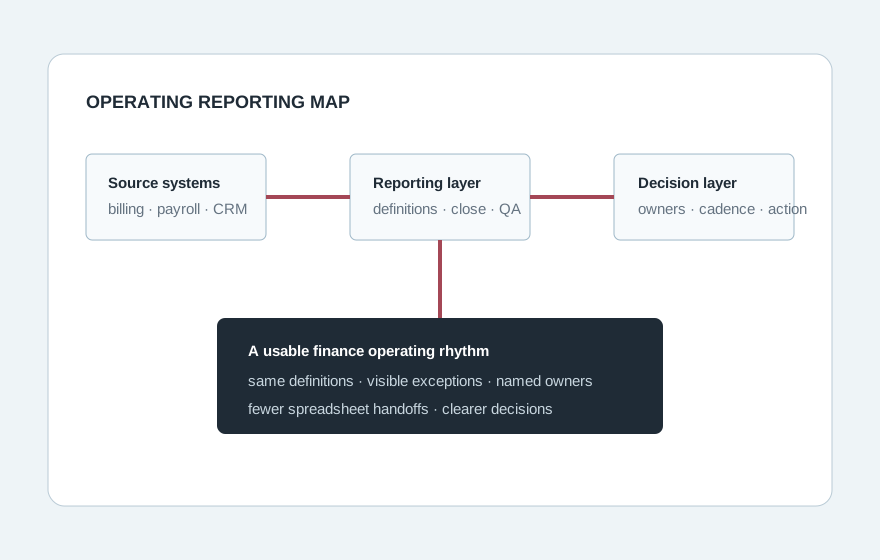
The work is not about adding more dashboards. It is about making the existing finance process easier to understand, repeat, and use.
Define the recurring decisions first, then shape the reporting package around the signals leaders actually need.
Reporting design →Map recurring tasks, ownership, source data, exception handling, and the points where spreadsheet work becomes fragile.
Finance operations →Create a practical cadence for assumptions, owners, scenario changes, and the story behind movement—not a prediction theater exercise.
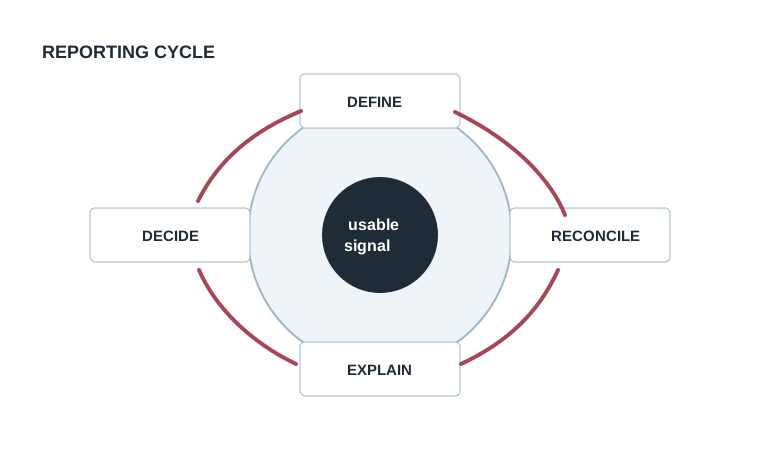
Forecast process →A strong reporting process connects definitions, reconciliation, explanation, and decisions. Break any one of those links and teams compensate with meetings and manual cleanup.
Service, project, recurring-revenue, and multi-location businesses create different reporting questions. The advisory scope starts with the operating model instead of forcing every company into one template.
Utilization, staffing, pipeline conversion, and delivery economics.
Backlog, estimates, change, timing, and project-level visibility.
Recurring revenue drivers, customer movement, and operating leverage.
Consistent definitions with enough room to explain local variance.
Thought-leadership content is part of the trust path—but each piece should help a buyer understand how the firm thinks, not fill a blog calendar.
Why “red versus green” reporting often skips the explanation leaders actually need.
Start with who decides what, when, and using which signal.